Connecting Explo to ClickHouse
Customer-facing analytics for any platform. Designed for beautiful visualization. Engineered for simplicity.
Goal
In this guide you will connect your data from ClickHouse to Explo and visualize the results. The chart will look like this:
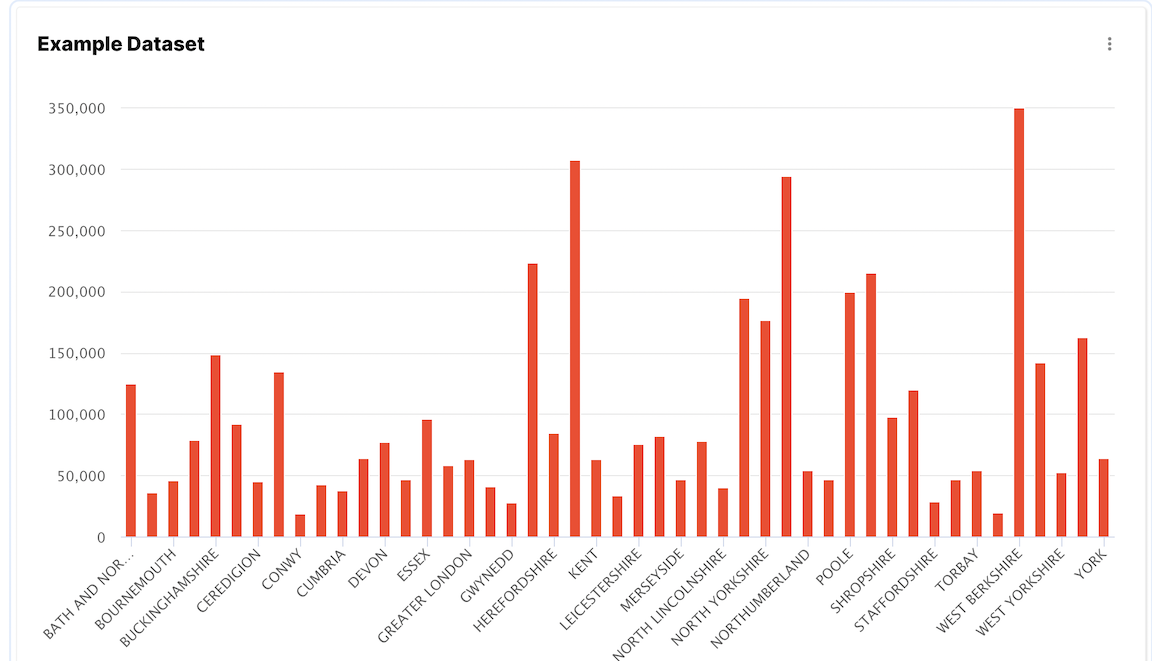
If you do not have a dataset to work with you can add one of the examples. This guide uses the UK Price Paid dataset, so you might choose that one. There are several others to look at in the same documentation category.
1. Gather your connection details
To connect to ClickHouse with HTTP(S) you need this information:
| Parameter(s) | Description |
|---|---|
HOST and PORT | Typically, the port is 8443 when using TLS or 8123 when not using TLS. |
DATABASE NAME | Out of the box, there is a database named default, use the name of the database that you want to connect to. |
USERNAME and PASSWORD | Out of the box, the username is default. Use the username appropriate for your use case. |
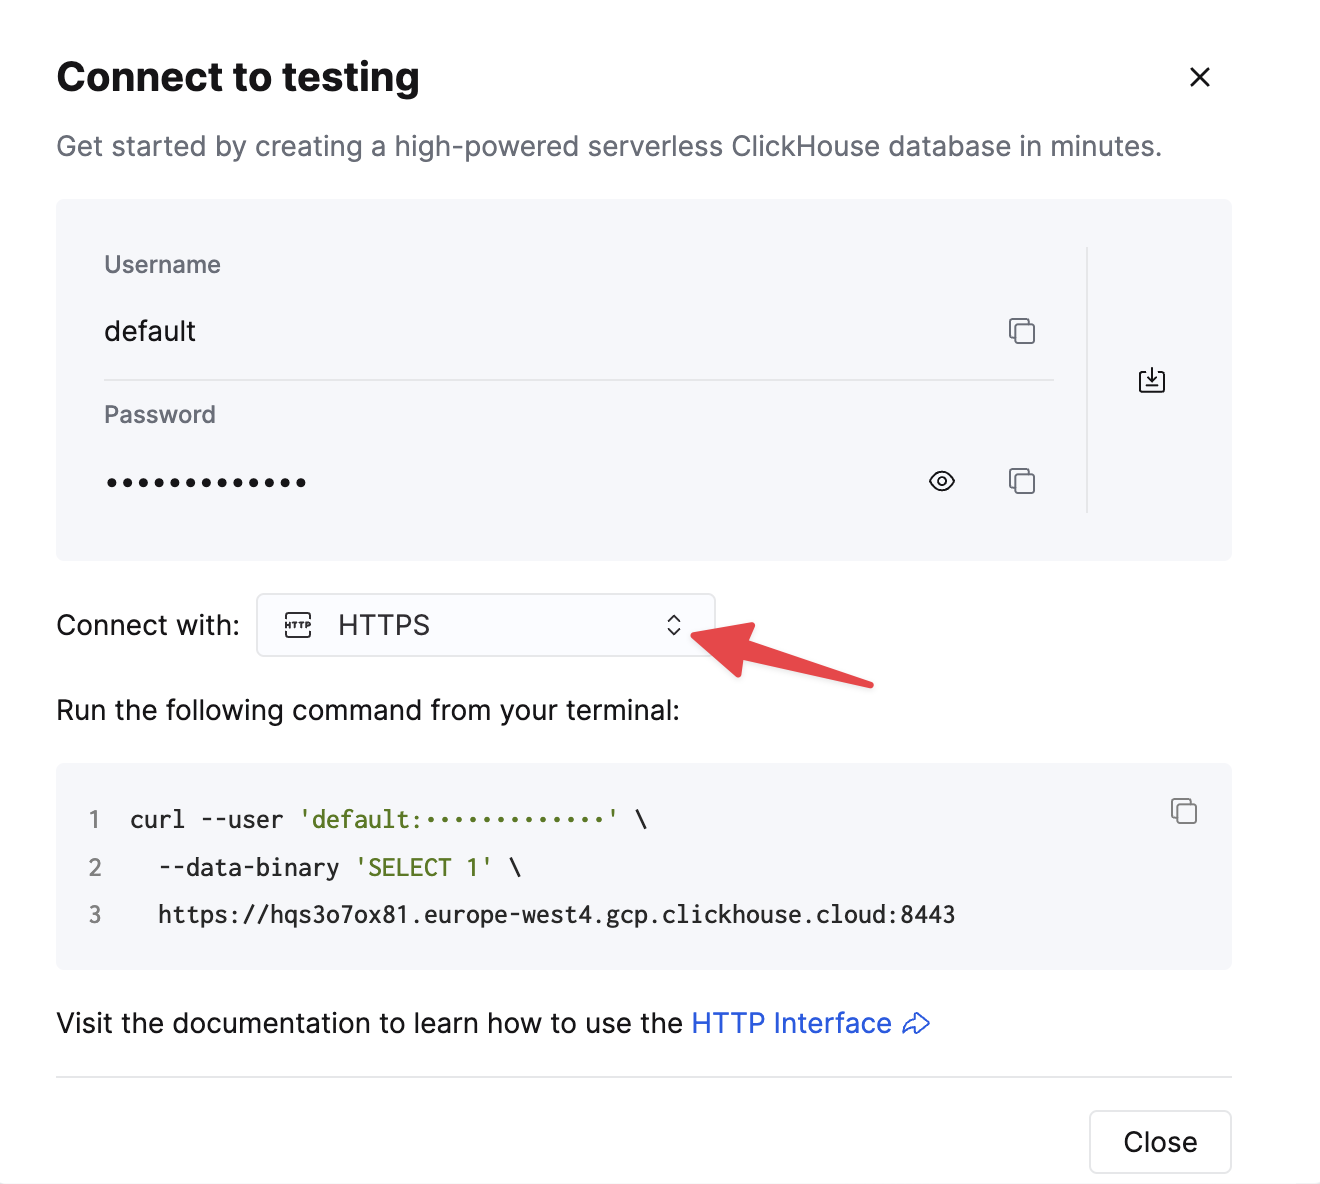
The details for your ClickHouse Cloud service are available in the ClickHouse Cloud console. Select a service and click Connect:
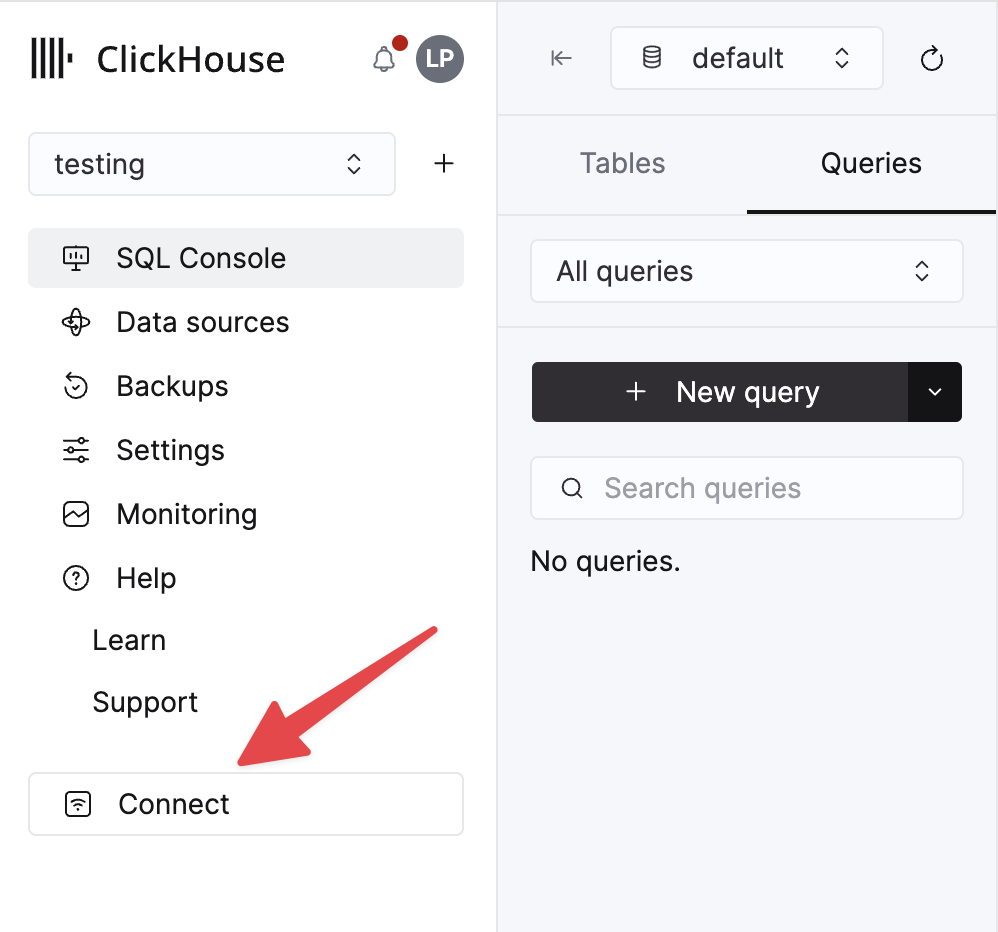
Choose HTTPS. Connection details are displayed in an example curl command.
If you are using self-managed ClickHouse, the connection details are set by your ClickHouse administrator.
2. Connect Explo to ClickHouse
-
Sign up for an Explo account.
-
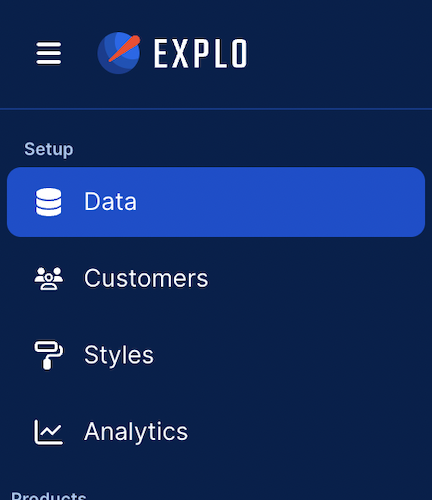
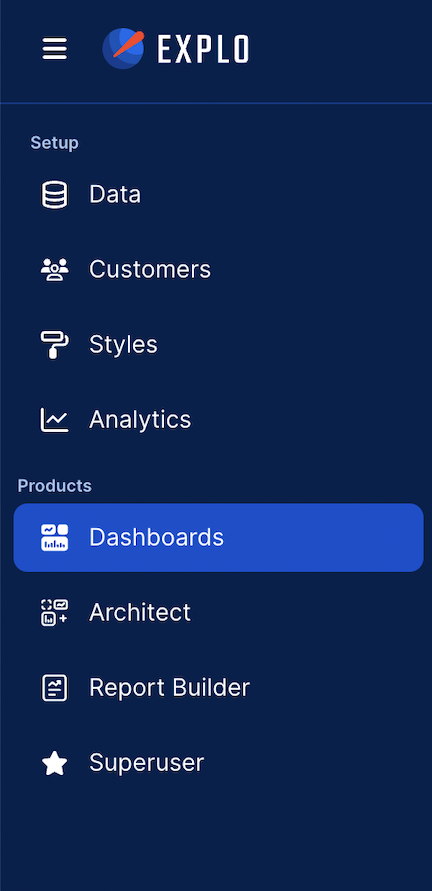
Click on the Explo data tab on the left hand sidebar.
- Click Connect Data Source in the upper right hand side.
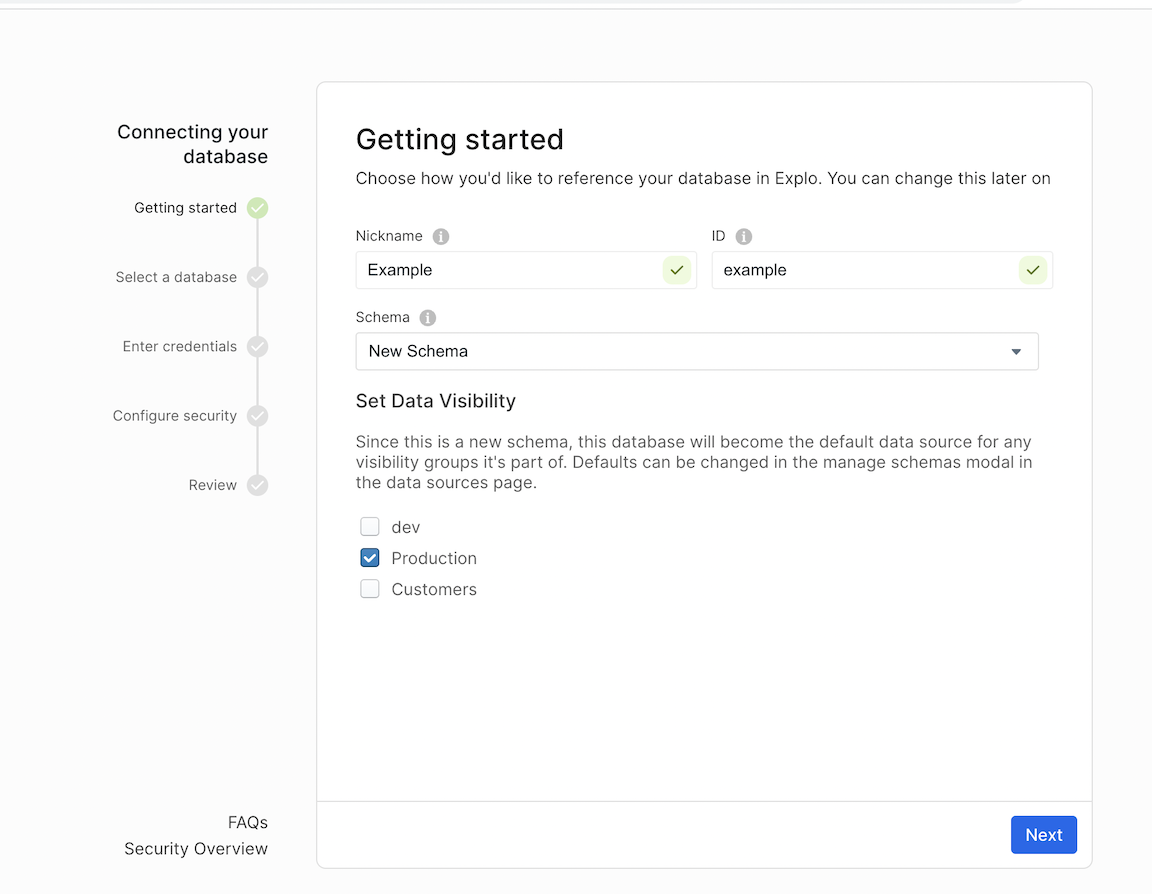
- Fill out the information on the Getting Started page
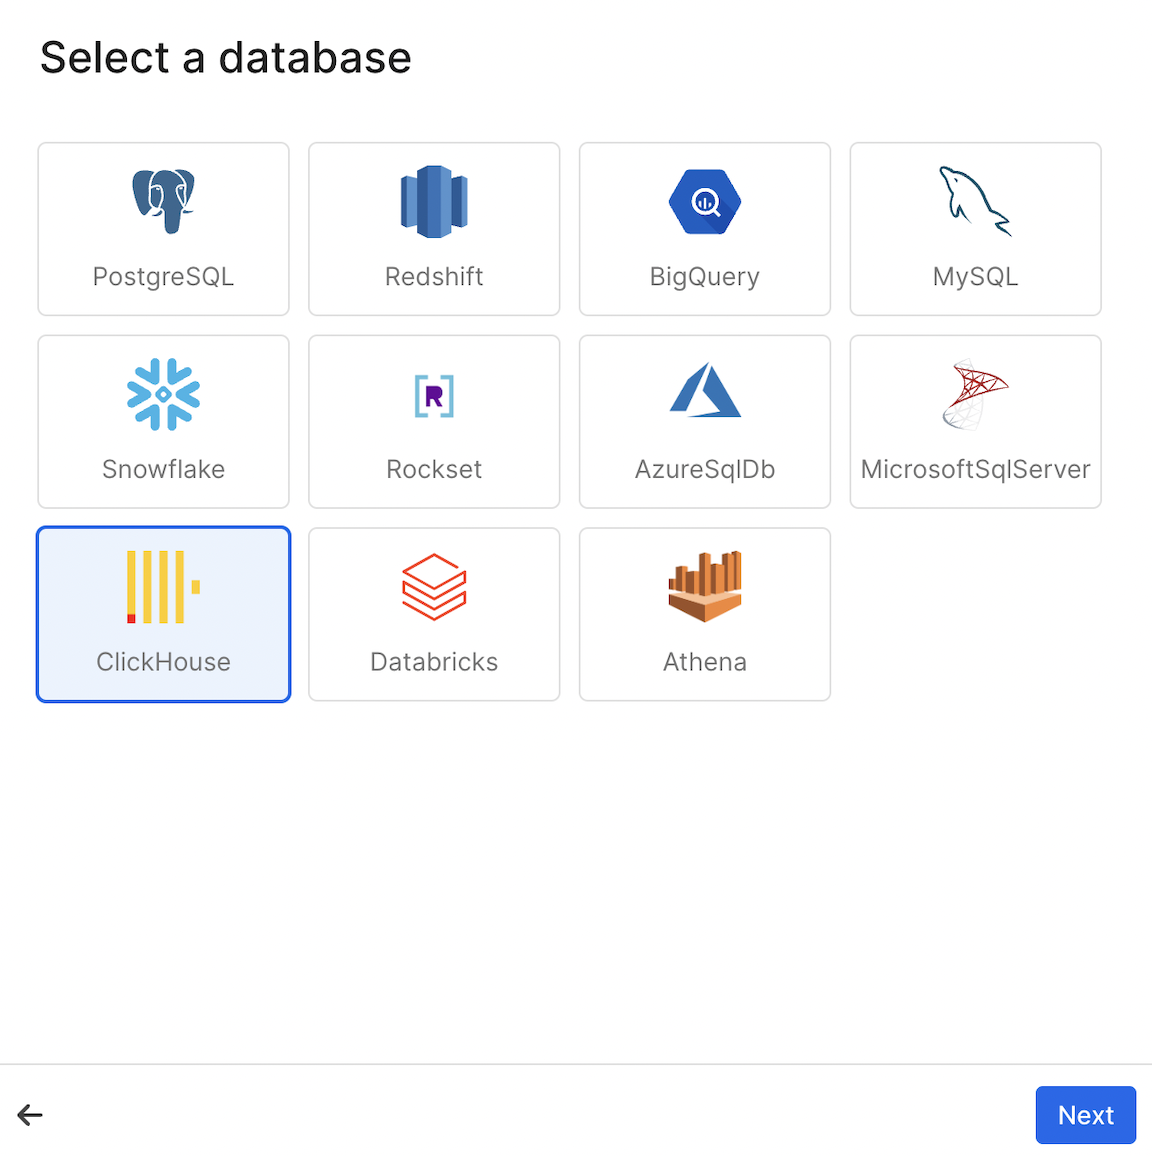
- Select Clickhouse
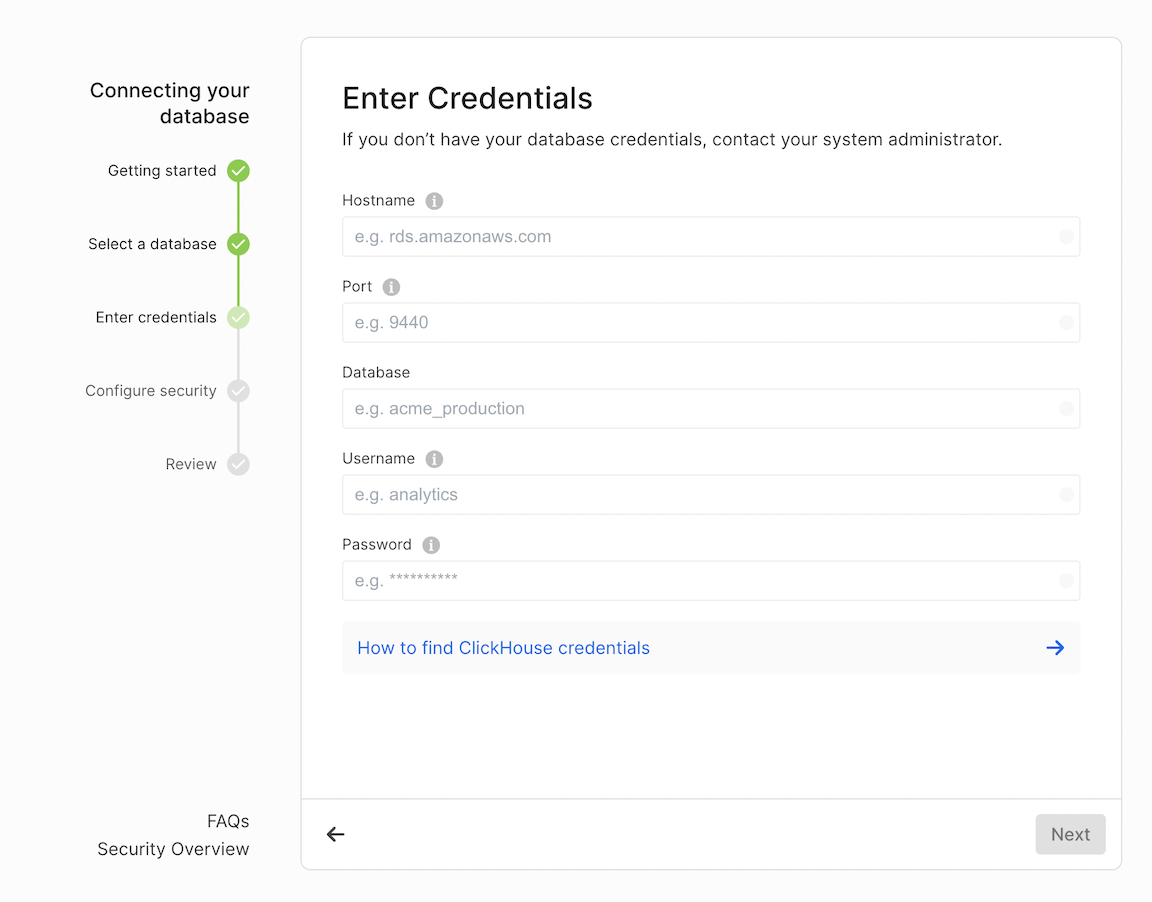
- Enter your Clickhouse Credentials.
- Configure Security
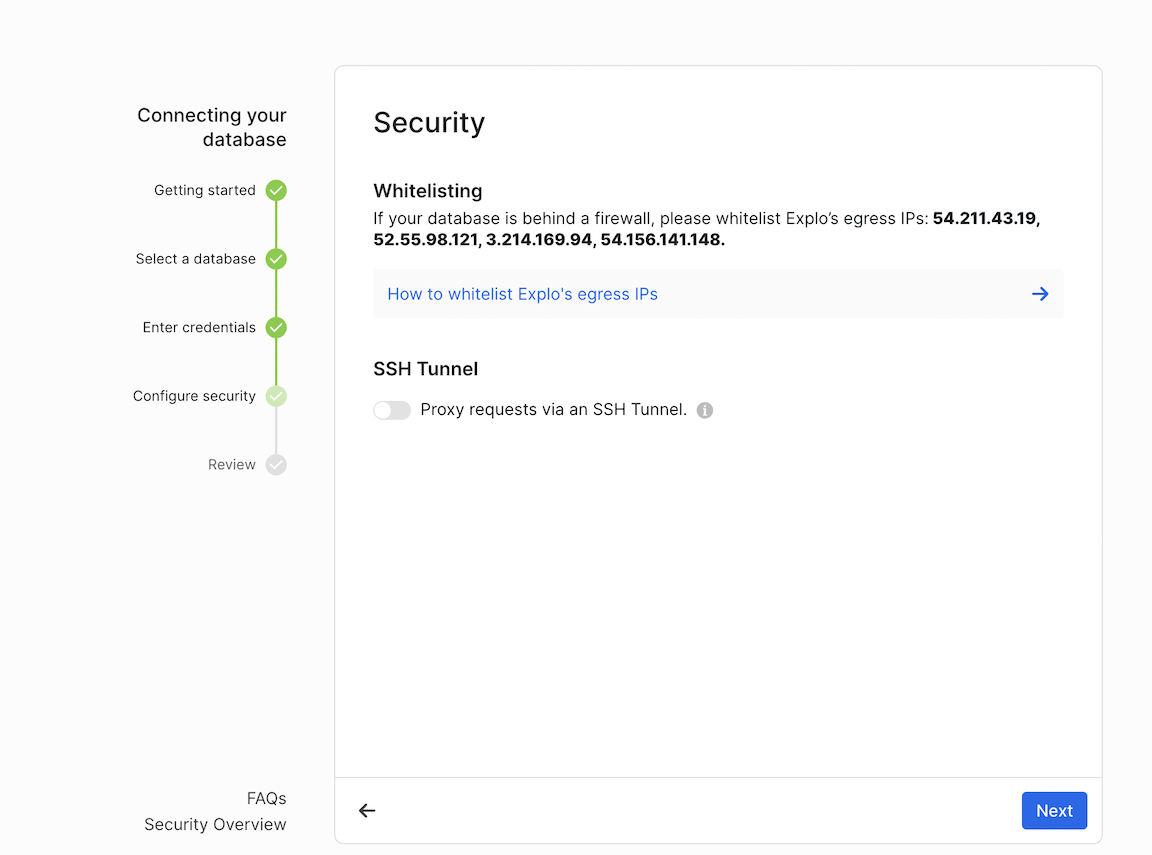
- Within Clickhouse, Whitelist the Explo IPs.
54.211.43.19, 52.55.98.121, 3.214.169.94, and 54.156.141.148
3. Create a Dashboard
- Navigate to Dashboard tab on the left side nav bar.
- Click Create Dashboard in the upper right corner and name your dashboard. You've now created a dashboard!

- You should now see a screen that is similar to this:
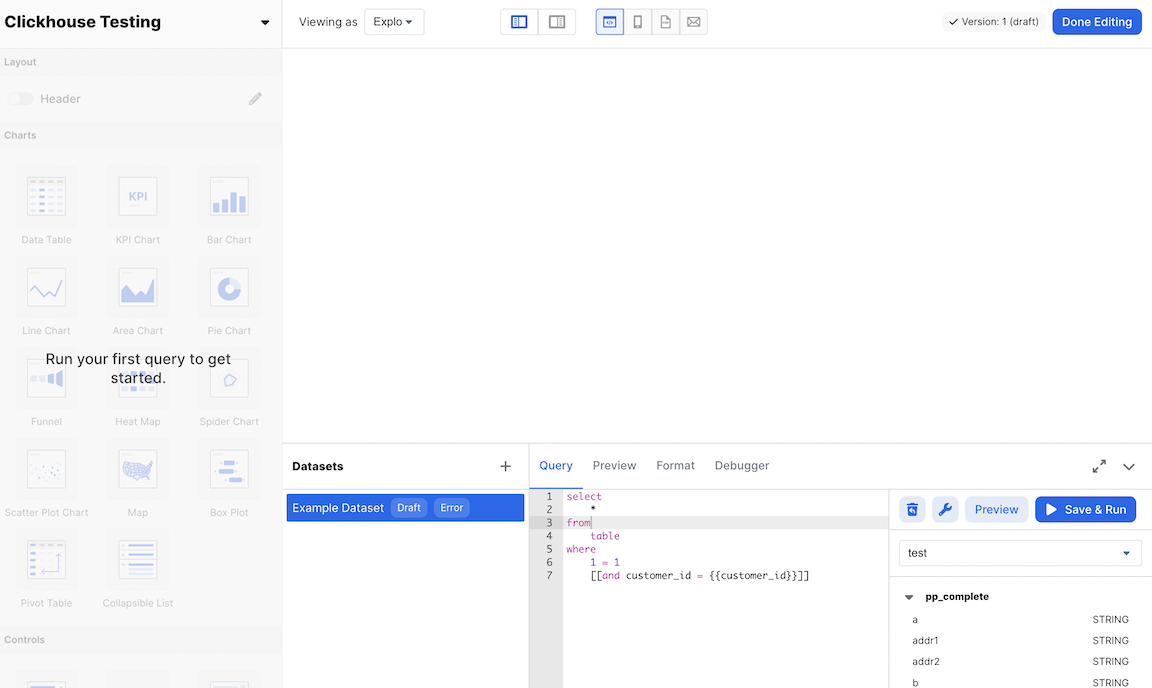
4. Run a SQL query
- Get your table name from the right hand sidebar under your schema title. You should then put the following command into your dataset editor:
SELECT * FROM YOUR_TABLE_NAME LIMIT 100
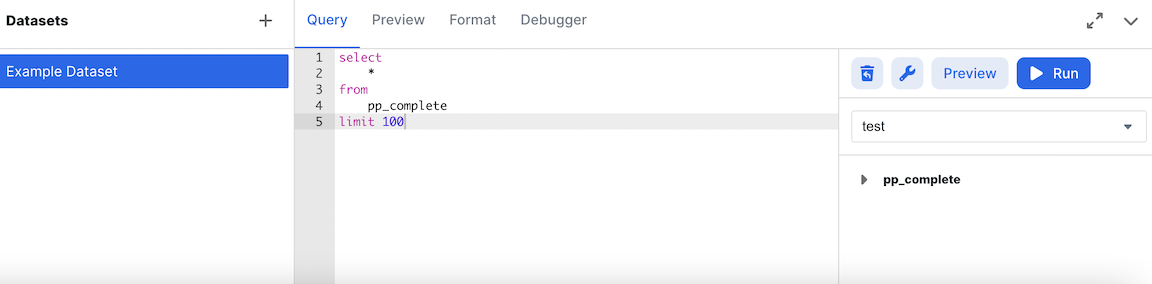
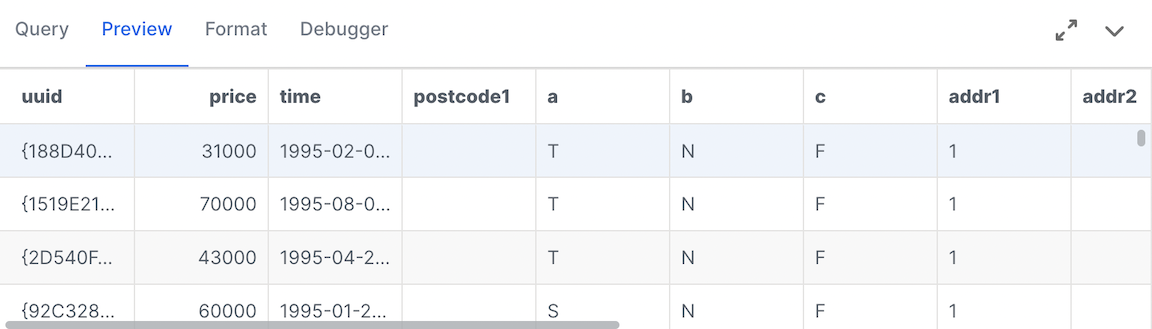
- Now click run and go to the preview tab to see your data.
5. Build a Chart
- From the left hand side, drag the bar chart icon onto the screen.
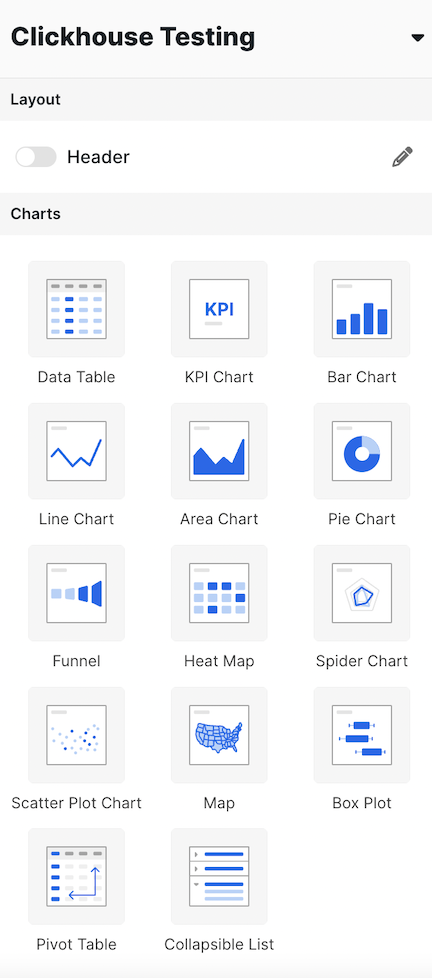
- Select the dataset. You should now see a screen like the following:
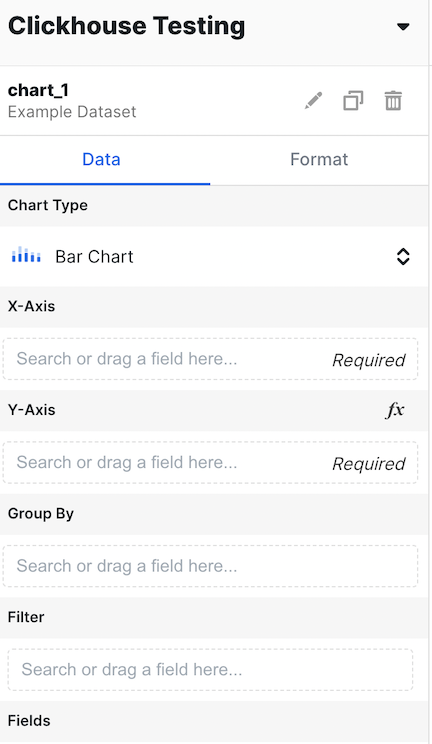
- Fill out the county in the X Axis and Price in the Y Axis Section like so:
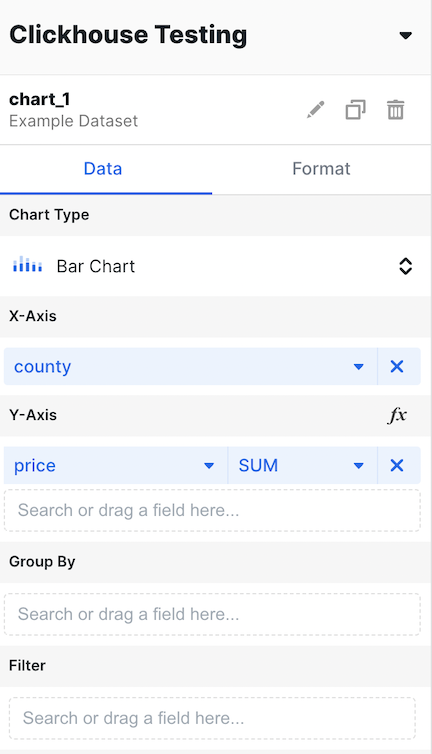
- Now, change the aggregation to AVG.
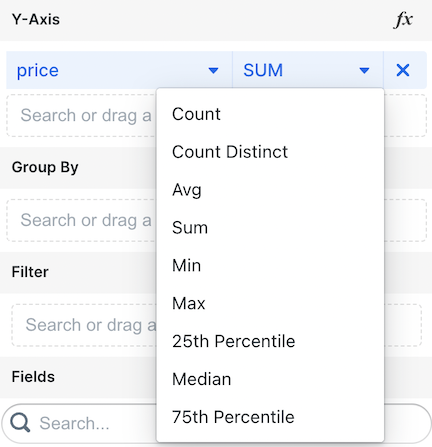
- We now have average price of homes broken down by price!
Learn more
Find more information about Explo and how to build dashboards by visiting the Explo documentation.
